Limited Portfolio Visibility
Difficulty monitoring performance across multiple properties and facilities.
Click to Call![]() +1 (888) 768-4846 (USA & Canada)
+1 (888) 768-4846 (USA & Canada)![]() +44 800 342 3556 (UK)
+44 800 342 3556 (UK)
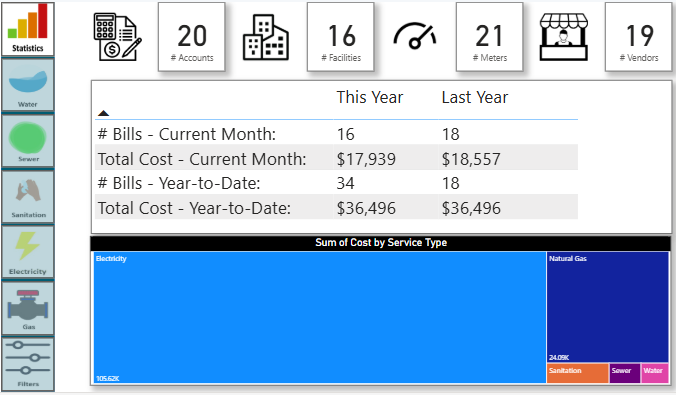
We help property and facilities management teams integrate maintenance, operations, financial, and occupancy data into powerful Power BI dashboards that provide real-time visibility into asset performance and operational efficiency.
Book a Free Property Power BI Consultation Now!📈 Portfolio Performance Monitoring
Track performance across properties, locations, and asset types.
🔧 Maintenance Analytics
Monitor maintenance activities, response times, and service efficiency.
📊 Occupancy & Space Utilization
Analyze occupancy rates and optimize space usage across facilities.
💰 Cost & Budget Tracking
Track operational expenses, maintenance costs, and budget performance.


Review property management systems, maintenance tools, and financial data sources.
Combine property, maintenance, and financial data into a unified model.
Build dashboards for portfolio performance, maintenance, and cost tracking.
Enable automated reporting and real-time data refresh.
Enable teams to use dashboards for ongoing monitoring and decision-making.
Real-Time Portfolio Visibility
Clear insights across all properties and facilities
Improved Cost Control
Better tracking of maintenance and operational expenses
Optimized Maintenance Operations
Monitor performance and reduce downtime
Data-Driven Decisions
Improve asset utilization and portfolio performance
Typical stakeholders who benefit from this service.
• Facilities management teams
• Real estate operators
• Asset managers
• Operations managers
• Maintenance teams
Yes, Power BI can connect to property management systems, CAFM platforms, maintenance systems, and financial tools to create unified dashboards across your entire portfolio.
You can track key metrics such as occupancy rates, maintenance costs, work order completion rates, space utilization, operating expenses, asset utilization, and tenant turnover. These are just examples — Power BI can track virtually any facilities or property management KPI as long as the underlying data is available and properly structured.
Yes, Power BI can centralize data from multiple properties, allowing you to monitor performance across locations and drill down into individual buildings, assets, or regions.
Yes, dashboards can track work order volumes, completion rates, response times, and backlog to improve maintenance efficiency and service delivery.
Yes, by analyzing historical maintenance data, dashboards can help identify patterns and support more proactive maintenance strategies.
Yes, Power BI can break down operating expenses, maintenance costs, and utilities by property, location, or asset type for better cost control.
Yes, dashboards can show how space is used across facilities, helping identify underutilized areas and opportunities for optimization.
Yes, Power BI can track asset usage, maintenance history, and performance trends to support better asset lifecycle management.
Yes, dashboards are designed to be intuitive and easy to use, allowing operations and facilities teams to access insights without technical expertise.
Yes, by identifying cost drivers, inefficiencies, and trends, dashboards help organizations optimize expenses and improve operational efficiency.
Power BI provides enterprise-grade security, including role-based access control and data protection features to safeguard sensitive operational data.
Yes, dashboards can be tailored for executives, property managers, maintenance teams, and operations leaders with role-specific insights.
Yes, dashboards can track occupancy, costs, and performance across your entire portfolio, helping you evaluate asset performance and make informed investment decisions.
30-minute strategy session. No obligation. Clear next steps.
Discover how Power BI dashboards can help you optimize maintenance, control costs, and improve performance across your properties and facilities.
30-minute strategy session. No obligation. Clear next steps.