Limited Store Performance Visibility
Difficulty tracking sales and performance across multiple stores or locations.
Click to Call![]() +1 (888) 768-4846 (USA & Canada)
+1 (888) 768-4846 (USA & Canada)![]() +44 800 342 3556 (UK)
+44 800 342 3556 (UK)
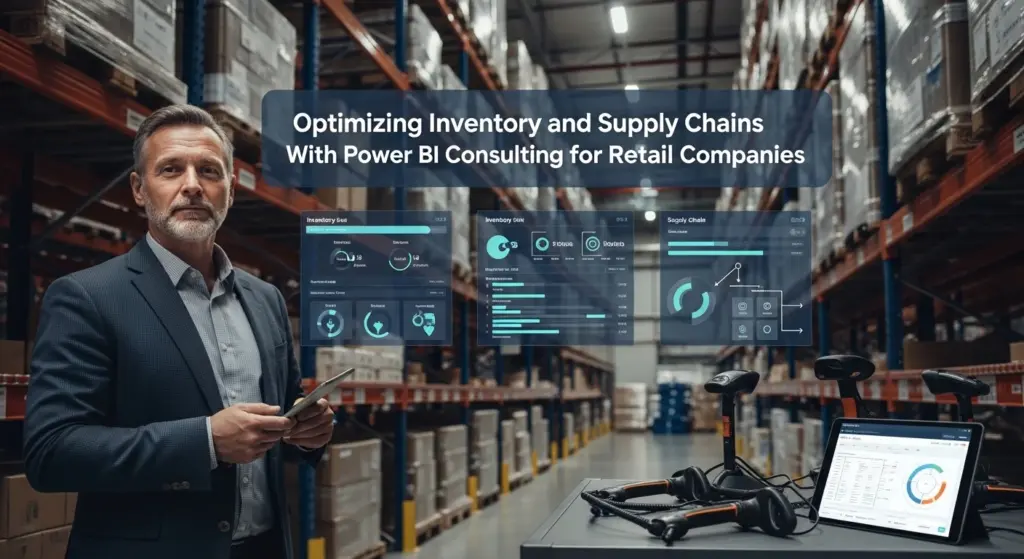
We help retail businesses integrate point-of-sale, inventory, customer, and financial data into powerful Power BI dashboards that provide real-time visibility into store performance, product trends, and customer behavior.
Book a Free Retail Power BI Consultation Now!📈 Sales Performance Monitoring
Track sales by store, product, and time period in real time.
📦 Inventory & Stock Analytics
Monitor stock levels, turnover rates, and replenishment needs.
🧑🤝🧑 Customer Behavior Insights
Analyze purchasing patterns, customer segments, and retention.
💰 Profitability & Margin Analysis
Understand margins across products, categories, and locations.


Review POS systems, inventory tools, and financial data sources.
Combine sales, inventory, customer, and financial data into a unified model.
Build dashboards for sales performance, inventory, and customer analytics.
Enable automated reporting and real-time data refresh.
Enable retail teams to use dashboards for ongoing monitoring and decision-making.
• Retail business owners
• Store managers
• Operations managers
• Merchandising teams
• Finance teams
• Multi-store retailers
Yes, Power BI can connect to most POS systems, inventory tools, and financial platforms to create unified retail dashboards.
You can track key metrics such as total sales, sales per store, inventory turnover, gross margin, average transaction value, and customer retention. These are just examples — Power BI can track virtually any retail KPI as long as the underlying data is available and properly structured.
Yes, dashboards can consolidate data across multiple stores and allow filtering by location, region, or store type.
Yes, Power BI can track stock levels, turnover, and demand trends to optimize inventory and reduce stockouts.
Yes, dashboards can analyze product performance, sales trends, and profitability across categories.
Yes, dashboards can analyze customer segments, purchase frequency, and buying patterns.
Yes, by analyzing sales, staffing, and operational metrics, dashboards help identify improvement opportunities across stores.
Yes, dashboards can calculate margins by product, category, and store location.
Most implementations take a few weeks depending on data complexity and integrations.
Yes, dashboards are designed to be intuitive and easy to use for store managers and operations teams.
Power BI provides enterprise-grade security, including role-based access control and data protection features.
Yes, dashboards can be tailored for executives, store managers, and merchandising teams.
Yes, by providing clear insights into sales, operations, and customer behavior, dashboards support data-driven growth.
30-minute strategy session. No obligation. Clear next steps.
Discover how Power BI dashboards can help you improve sales performance, optimize inventory, and make smarter retail decisions.
30-minute strategy session. No obligation. Clear next steps.